Why Rising Foreclosure Headlines Aren’t a Red Flag for Today’s Housing Market

If you’ve seen headlines saying foreclosure activity has been climbing for 10 straight months, it’s easy to assume that’s a sign of trouble for the housing market. But when you look at the full picture, a few simple truths become clear:
- Today’s foreclosure numbers are in line with what’s considered normal
- High home equity is keeping most homeowners in a strong financial position
- None of the data points to a big wave of distressed sales that’ll crash the market
Foreclosure Filings Are Up 32%, But That Doesn’t Mean the Market’s in Trouble
If you peel the layers all the way back, what everyone is actually worried about is that we’re headed for a repeat of what happened in 2008. Back then, riskier lending practices and an oversupply of homes for sale brought home prices down and led to a significant increase in foreclosures. A lot of people felt the impact. But this isn’t the same situation.
Yes, ATTOM data shows foreclosure filings are up 32% year-over-year. And that increase is going to sound dramatic. But context matters, and it doesn’t mean we’re headed for another crash. And the numbers prove it. Take a look at where we were during the last crash (the red in the graph below). And where we are now (the blue):
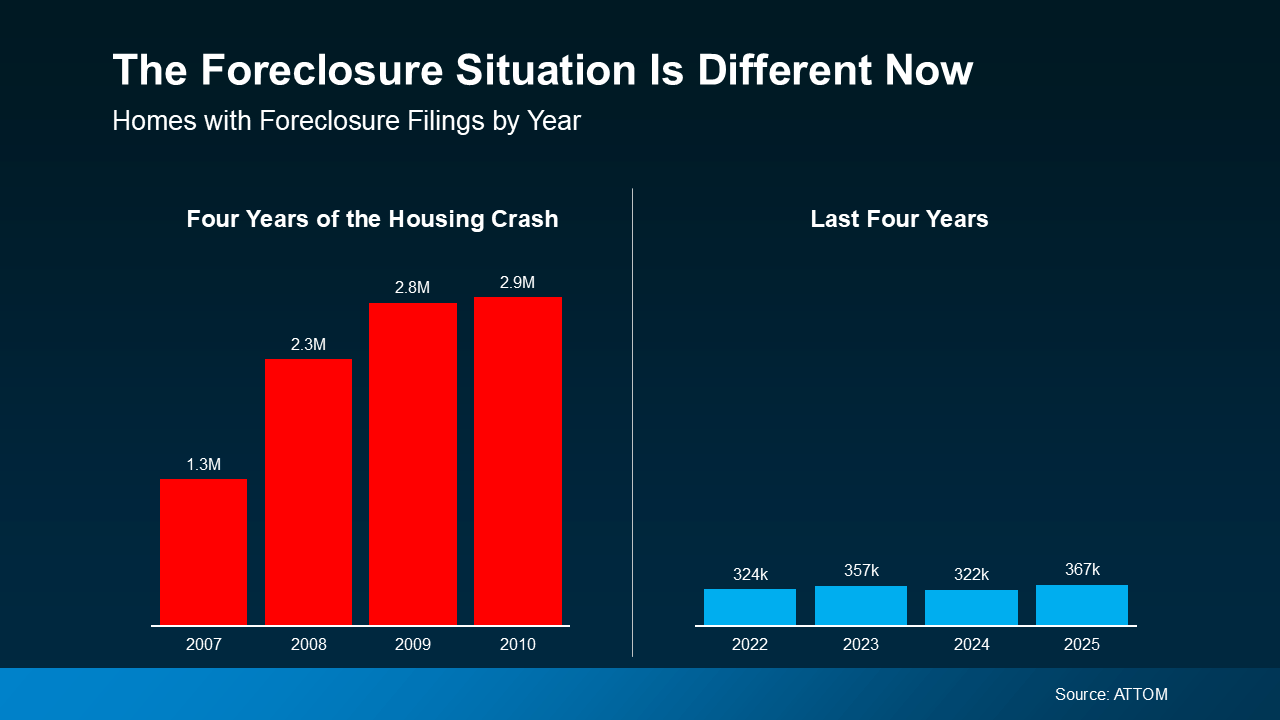 Even with the uptick lately, we are still nowhere near crash levels – far from it. This isn’t a return to crisis levels. What it is, is a return to normal.
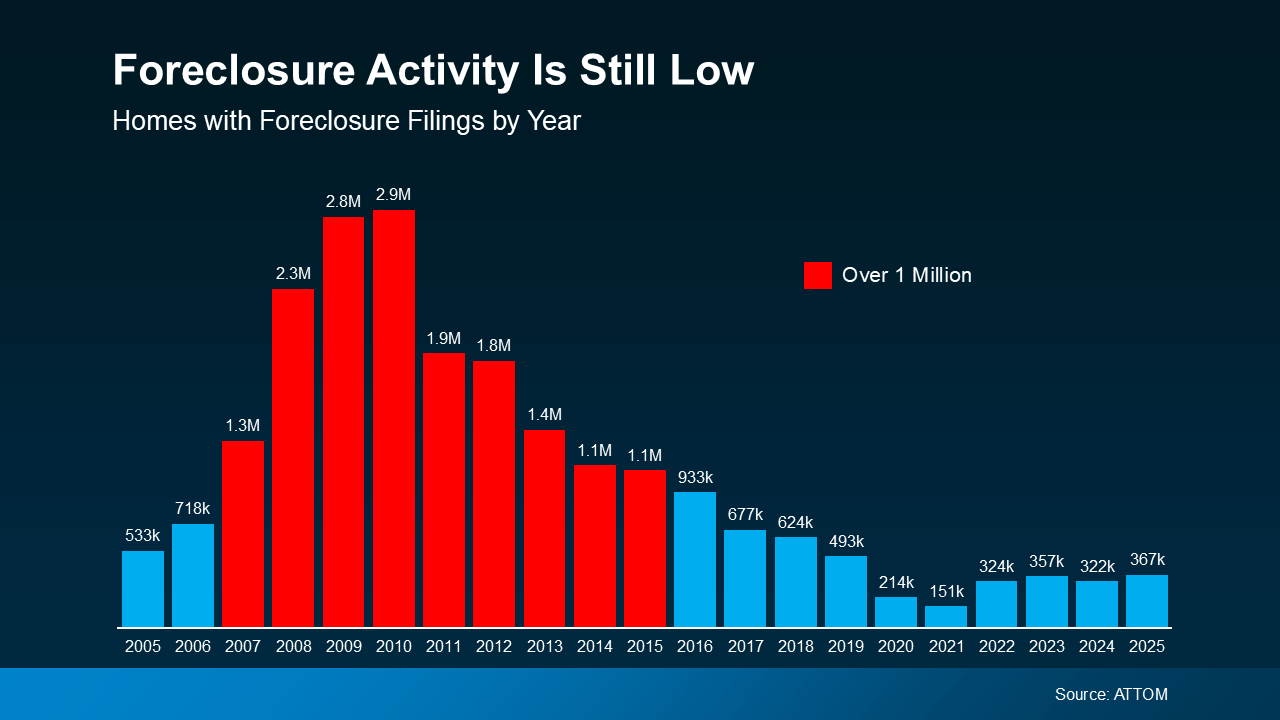
The graph below shows foreclosure filings going all the way back to early 2005. The lead up to, and the aftermath of, the crash is there in red. Those are the years when foreclosure filings went above the 1 million mark each year.
Now, look at the right side and scan back to the 2017–2019 range (the last truly normal years for housing). You’ll see we’re actually just starting to fall back in line with what’s typical for the market, even with the increase lately:
 Rob Barber, CEO at ATTOM, explains it well:
“Foreclosure activity increased in 2025, reflecting a continued normalization of the housing market following several years of historically low levels . . . While filings, starts, and repossessions all rose compared to 2024, foreclosure activity remains well below pre-pandemic norms and a fraction of what we saw during the last housing crisis . . . today’s uptick is being driven more by market recalibration than widespread homeowner distress, with strong equity positions and more disciplined lending continuing to limit risk.”
The word “normalization” in that quote is extra important. While economic and financial pressures are putting a strain on some homeowners, this isn’t a flood of distressed homes. No matter what the headlines may have you believe, this isn’t a large-scale crisis.
Today’s increase isn’t a sign of trouble. It’s a return to normal.
Why This Isn’t a Repeat of 2008
Even though the last housing crash still shapes how a lot of people interpret today’s news, the reality is, this is a different market:
- Lending standards are stronger
- Borrowers are more qualified
- And homeowners have far more equity
And that equity piece is especially important. Over the last five years, home prices have risen significantly. For many people, their house is worth far more than they paid for it. That means most homeowners have a strong financial cushion to fall back on, if needed.
Basically, if someone faces hardship today, they often have the option to sell, and maybe even walk away with money in their pocket, instead of going through foreclosure. That’s a major contrast to 2008, when many homeowners owed more than their home was worth.
Bottom Line
Foreclosure activity may be rising, but it’s still well within a normal range – and nowhere close to the danger zones of the past. But the headlines are doing more to terrify than clarify. And that’s exactly why having a trusted real estate expert you can call on is so important.
When you hear something in the news or see something on social about housing that worries you, reach out to a local agent. An expert will have the context needed to explain what’s really happening and how it impacts you (if at all).